 Size
Class Ratios :
Size
Class Ratios :
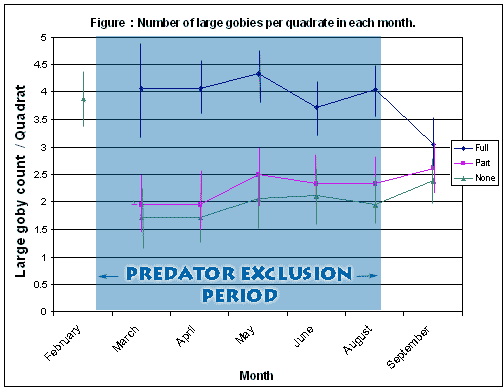
The most interesting part of the results of the 'Predator Exclusion Study' was the difference between the size classes of the caged and non-caged/partial-caged treatments. Figure 2 represents the third sampling month after the cages were installed. In each treatment, the average number of gobies/quadrate is around 24 (see Tabular Data). This makes the size of each block equal to a similar number of gobies for each treatment. Looking at the graph we can see that the yellow (large gobies) block for the fully caged treatment is about twice as big as the others. We can also see that the blue block (small gobies) is about half as big for the fully caged section (For a detailed view of all months go click on: SIZE CLASS DISTRIBUTION GRAPHS)